? A mathematician analyzes it")
How many so many would have marked Budimir with the occasions of Mbappé (and vice versa)? A mathematician analyzes it
What are the expected goals?
Specifically, a new way of measuring the efficiency of the scorers is to compare their percentiles (goals achieved) in the context of the probabilistic distribution of their occasions (expected goals, XG).
Large -scale shots group
Well, using the same metric we can exchange (virtually) players between teams. If we choose Kylian Mbappé and against Budimir, first and third scorer of the current Spanish League, we can group their corresponding shots and XG to calculate the individual probabilities of each number of goals. Thus we can compare goals (expected) with goals (achieved) in its same units.
This value will give us the efficiency of each one, which we will transport to the occasions of the other to be able to answer the question that gives title to this article. But not with average values, as is usually done, but each with the distribution of their occasions.
We calculate the probability that the shots recorded in the competition become a certain number of goals (0, 1, 2 …). With two occasions it seems simple and is calculated very easy, but if the number increases, it is more complicated.
For example, if we have 5 shots, the probability of putting 3 has to combine all shots in groups of 3 successful and 2 failed, which grows very markedly. In the case at hand, we have 161 shots of one and 99 of the other, which makes the intractable problem if we need to calculate all combinations and calculate its results.
What is the convolution?
The accumulated probability function assigns a value to its percentile range, which consists of a position of position that divides a distribution into 100 equal parts, indicating the percentage of data that are below that value.
ABATITTO PERCENTILES ON YOUR TEAM
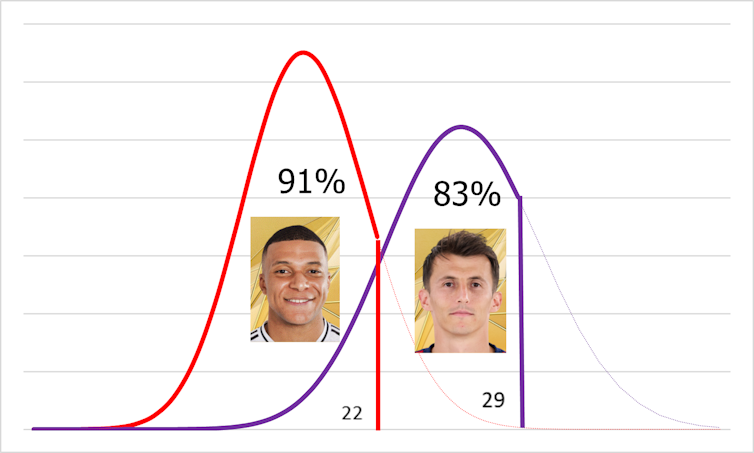
From the total of 161 shots thrown by Kylian Mbappé, it is very unlikely to get 161 goals, but not impossible. Therefore its probability is not zero. The same goes for 99 Budimir shots. We obtain for each number of possible goals its probability, which accumulates in such a way that the Mbappé percentile with respect to its goal distribution is obtained by adding the chances of getting from 0 to their 31 goals. This gives us a value of 0.91. Therefore, we establish the 91th percentile.
For Budimir we do it with its 21 goals resulting in a value of 0.83, Percentil 83. We can therefore conclude that the efficiency of both is very high but with differences that we will translate into goals exchanging the scenarios.
Budimir at Real Madrid, Mbappé in Osasuna
Attending to this, if the Frenchman had played in Osasuna, he would have achieved an additional goal, 22 (21). If the Croatian had dressed in white, he would have achieved two less goals, 29 (31). This exchanged calculation is done in reverse, seeing how many goals cover the percentiles of each player in the distribution of the occasions of the other.
Although there are aspects in the assessment of soccer players that we are not considering, at least we have managed to dress Mbappé de Rojillo and Merengue Budimir, evaluating the most important thing about the performance of their positions: the goals.
Only two goals distance the performance of both if we had exchanged them. There are rumors that suggest that Croatian can wear white next season. Our study has advanced how many goals would have achieved if you have done so during the concluded season.
If we were the sports director of the club, we could not advise their hiring. Its efficiency is high and promises to continue being in the next seasons, whether “red” or with another shirt.
(Tagstotranslate) so many